Visual Identity Meets
Performance Analytics
The traditional QR code is a structural relic — a sterile, black-and-white matrix that conceals destination intent and strips personal brands of their visual authority. YLQR.NET bridges the gap between graphic aesthetics and data engineering. By integrating high-fidelity thematic contours and brand icons directly into the functional layout of the pixel grid, we transform an ordinary utility into a compelling visual asset.
Beyond aesthetics lies a robust analytical infrastructure. Every custom QR code deployed via YLQR.NET serves as an autonomous data node, streaming real-time operational telemetry back to a centralized dashboard. For individual creators and enterprise ecosystems alike, YLQR.NET redefines offline-to-online (O2O) tracking, offering absolute clarity over the entire lifecycle of a physical scan.
B2C: The Architecture of Digital Identity
In the consumer ecosystem, a QR code is no longer just a digital link — it is a visual avatar and a core element of personal branding. The primary catalyst for B2C adoption is the seamless shift from sterile utility to expressive identity representation.
When an individual deploys a customized matrix generated via YLQR.NET, they achieve immediate communicative advantages:
- Pre-Signaling & Identity Placement: Users can declare their professional identity, specific passions, or industry expertise before a scan even occurs. An artist, pilot, engineer, or photographer can embed an explicit niche symbol directly into their physical matrix, signaling their core specialization instantly.
- Social Ecosystem Custom Icons: Instead of relying on generic overlays that disrupt scannability, the system organically integrates recognizable silhouettes of platforms like Telegram, Discord, TikTok, or Instagram directly into the pattern of pixels, maintaining a clean and uniform style.
- Visual Trust & CTR Optimization: Modern internet users are inherently cautious about unbranded links and anonymous tracking squares. A beautifully crafted QR design reduces scan hesitation and naturally elevates click-through rates by establishing an immediate baseline of authenticity, ownership, and visual delight.
B2B Enterprise: Multichannel Campaign Infrastructure
The core innovation of the YLQR.NET business model lies in its intelligent campaign nesting. For any marketing drive, our platform generates a unified group of visually identical QR codes. To the public eye, these matrices feature the exact same cohesive brand design and route users to the same destination. Beneath the surface, every single code carries its own isolated tracking signature.
[Unified Brand Design / Target URL] ----> [QR Code B: Flyer] → Individual Analytics
\---> [QR Code C: Package] → Individual Analytics
↓
[YLQR.NET Master Dashboard]
(Unified Comparative Insights)
- Offline A/B Testing: Marketing teams can compare the effectiveness of a billboard in the city center against a flyer distributed at an event. The platform provides comparative charts showing exactly which placement delivers the highest scan velocity and real return on investment.
- Brand Safety & Anti-Phishing: By embedding a high-fidelity corporate logo directly into the pixel structure, YLQR.NET creates a visually protected asset. Because the logo is anatomically fused with the functional data blocks, cloning or replicating the code without breaking its underlying link routing becomes exceptionally difficult.
The Analytics Core: Telemetry and Spatial Mapping
Behind the visual layout of every YLQR.NET matrix lies an enterprise-grade telemetry engine. This infrastructure tracks, decodes, and structuralizes every scan event across global touchpoints, delivering actionable business intelligence through a detailed data suite.
Granular Audience & Channel Diagnostics
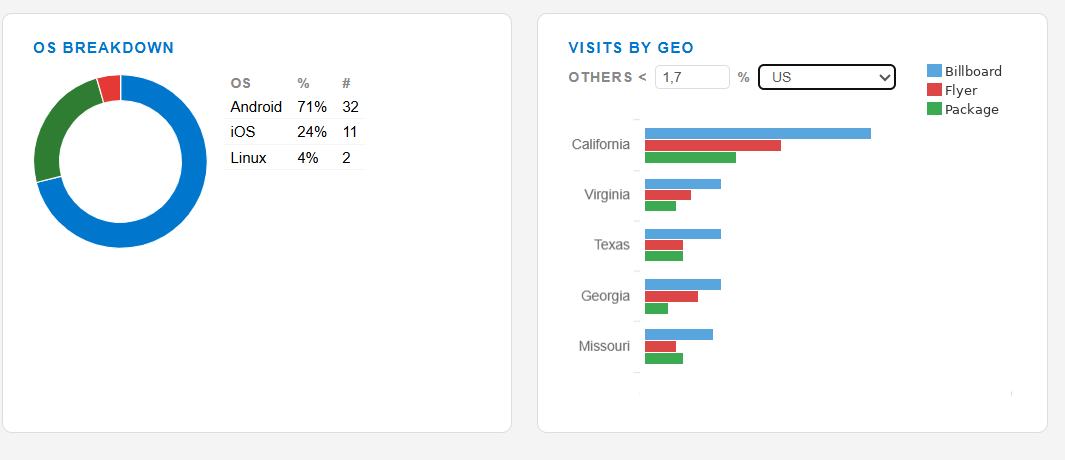
Dashboards provide intuitive segment insights, isolating scanning distributions across operating systems (iOS vs Android), browsers, and system languages. Multi-channel grouped charts show at a glance which advertising placement is performing — comparing Billboard, Flyer, and Package distribution vectors side by side in real time.
Time-Lapse Spatial Telemetry (GEO Maps)
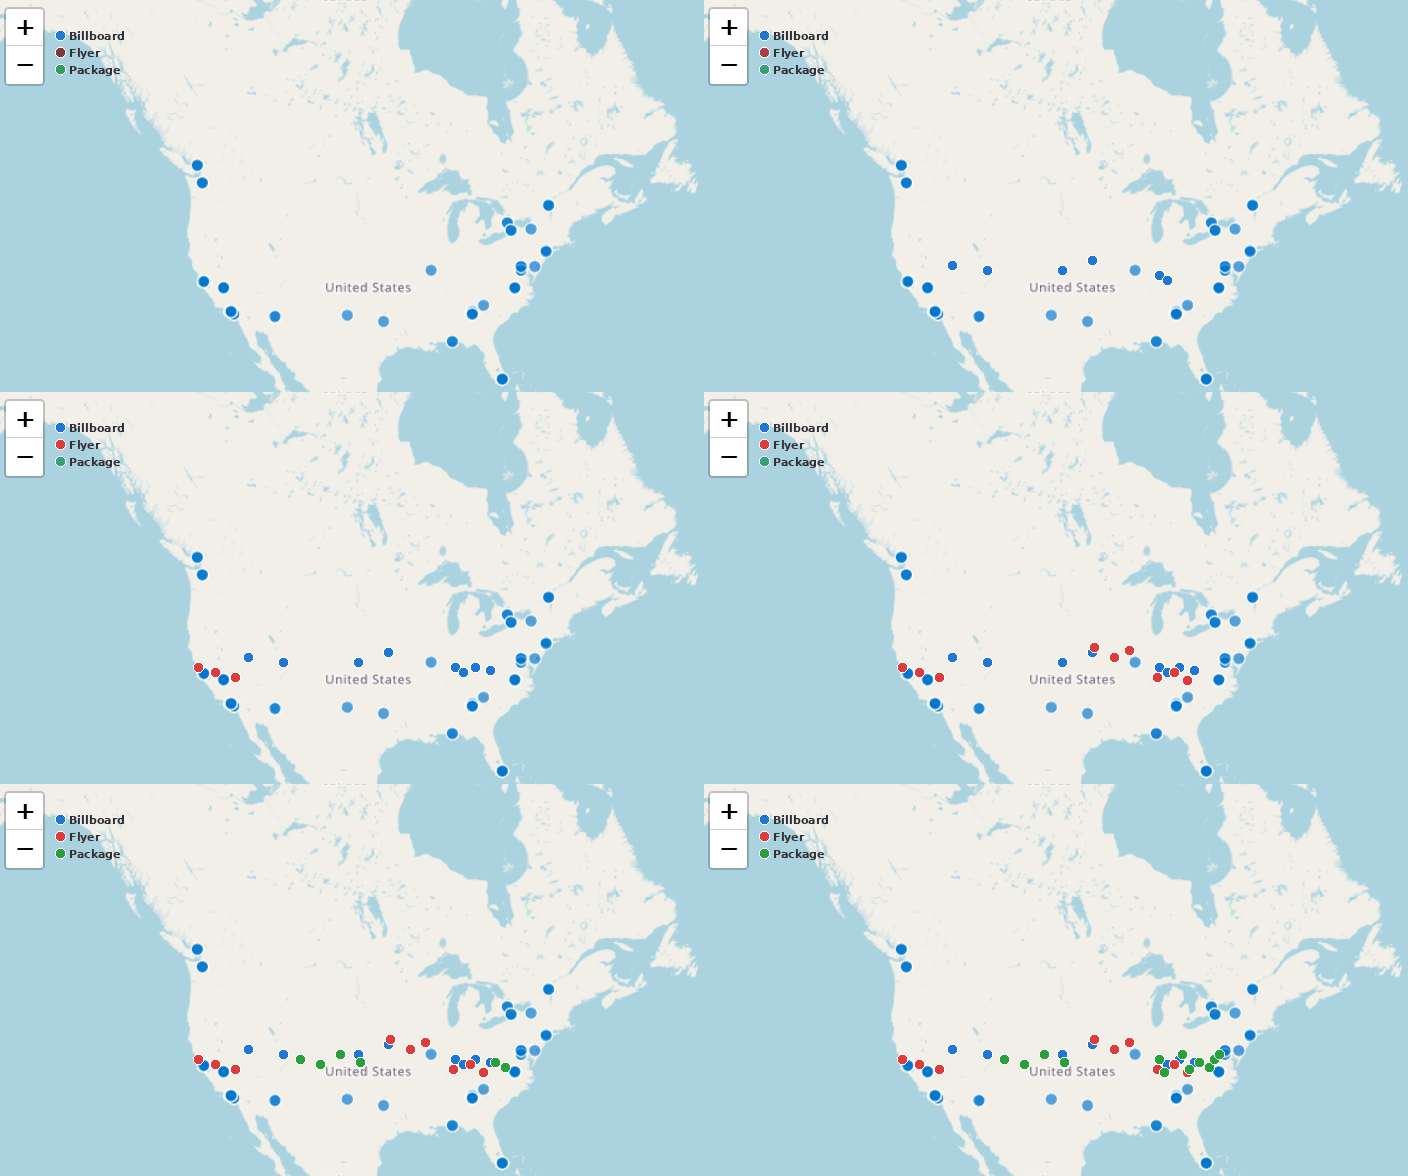
The crowning component of the YLQR.NET data engine is the interactive, time-lapse spatial mapping module. The system registers the exact geographic origin of every scan down to country and municipality boundaries. Marketers can trigger animated playback to visually trace the sequential expansion of an offline campaign — watching scan waves ripple across maps in chronological order as target demographics interact with assets across multiple channels.
Start Building Your Campaign
YLQR.NET is not merely an aesthetic generator — it is a unified marketing ecosystem engineered to eliminate data blindness in offline advertising. Join creators and businesses already using custom QR intelligence.